Find The Slowest Trending Pages Quickly
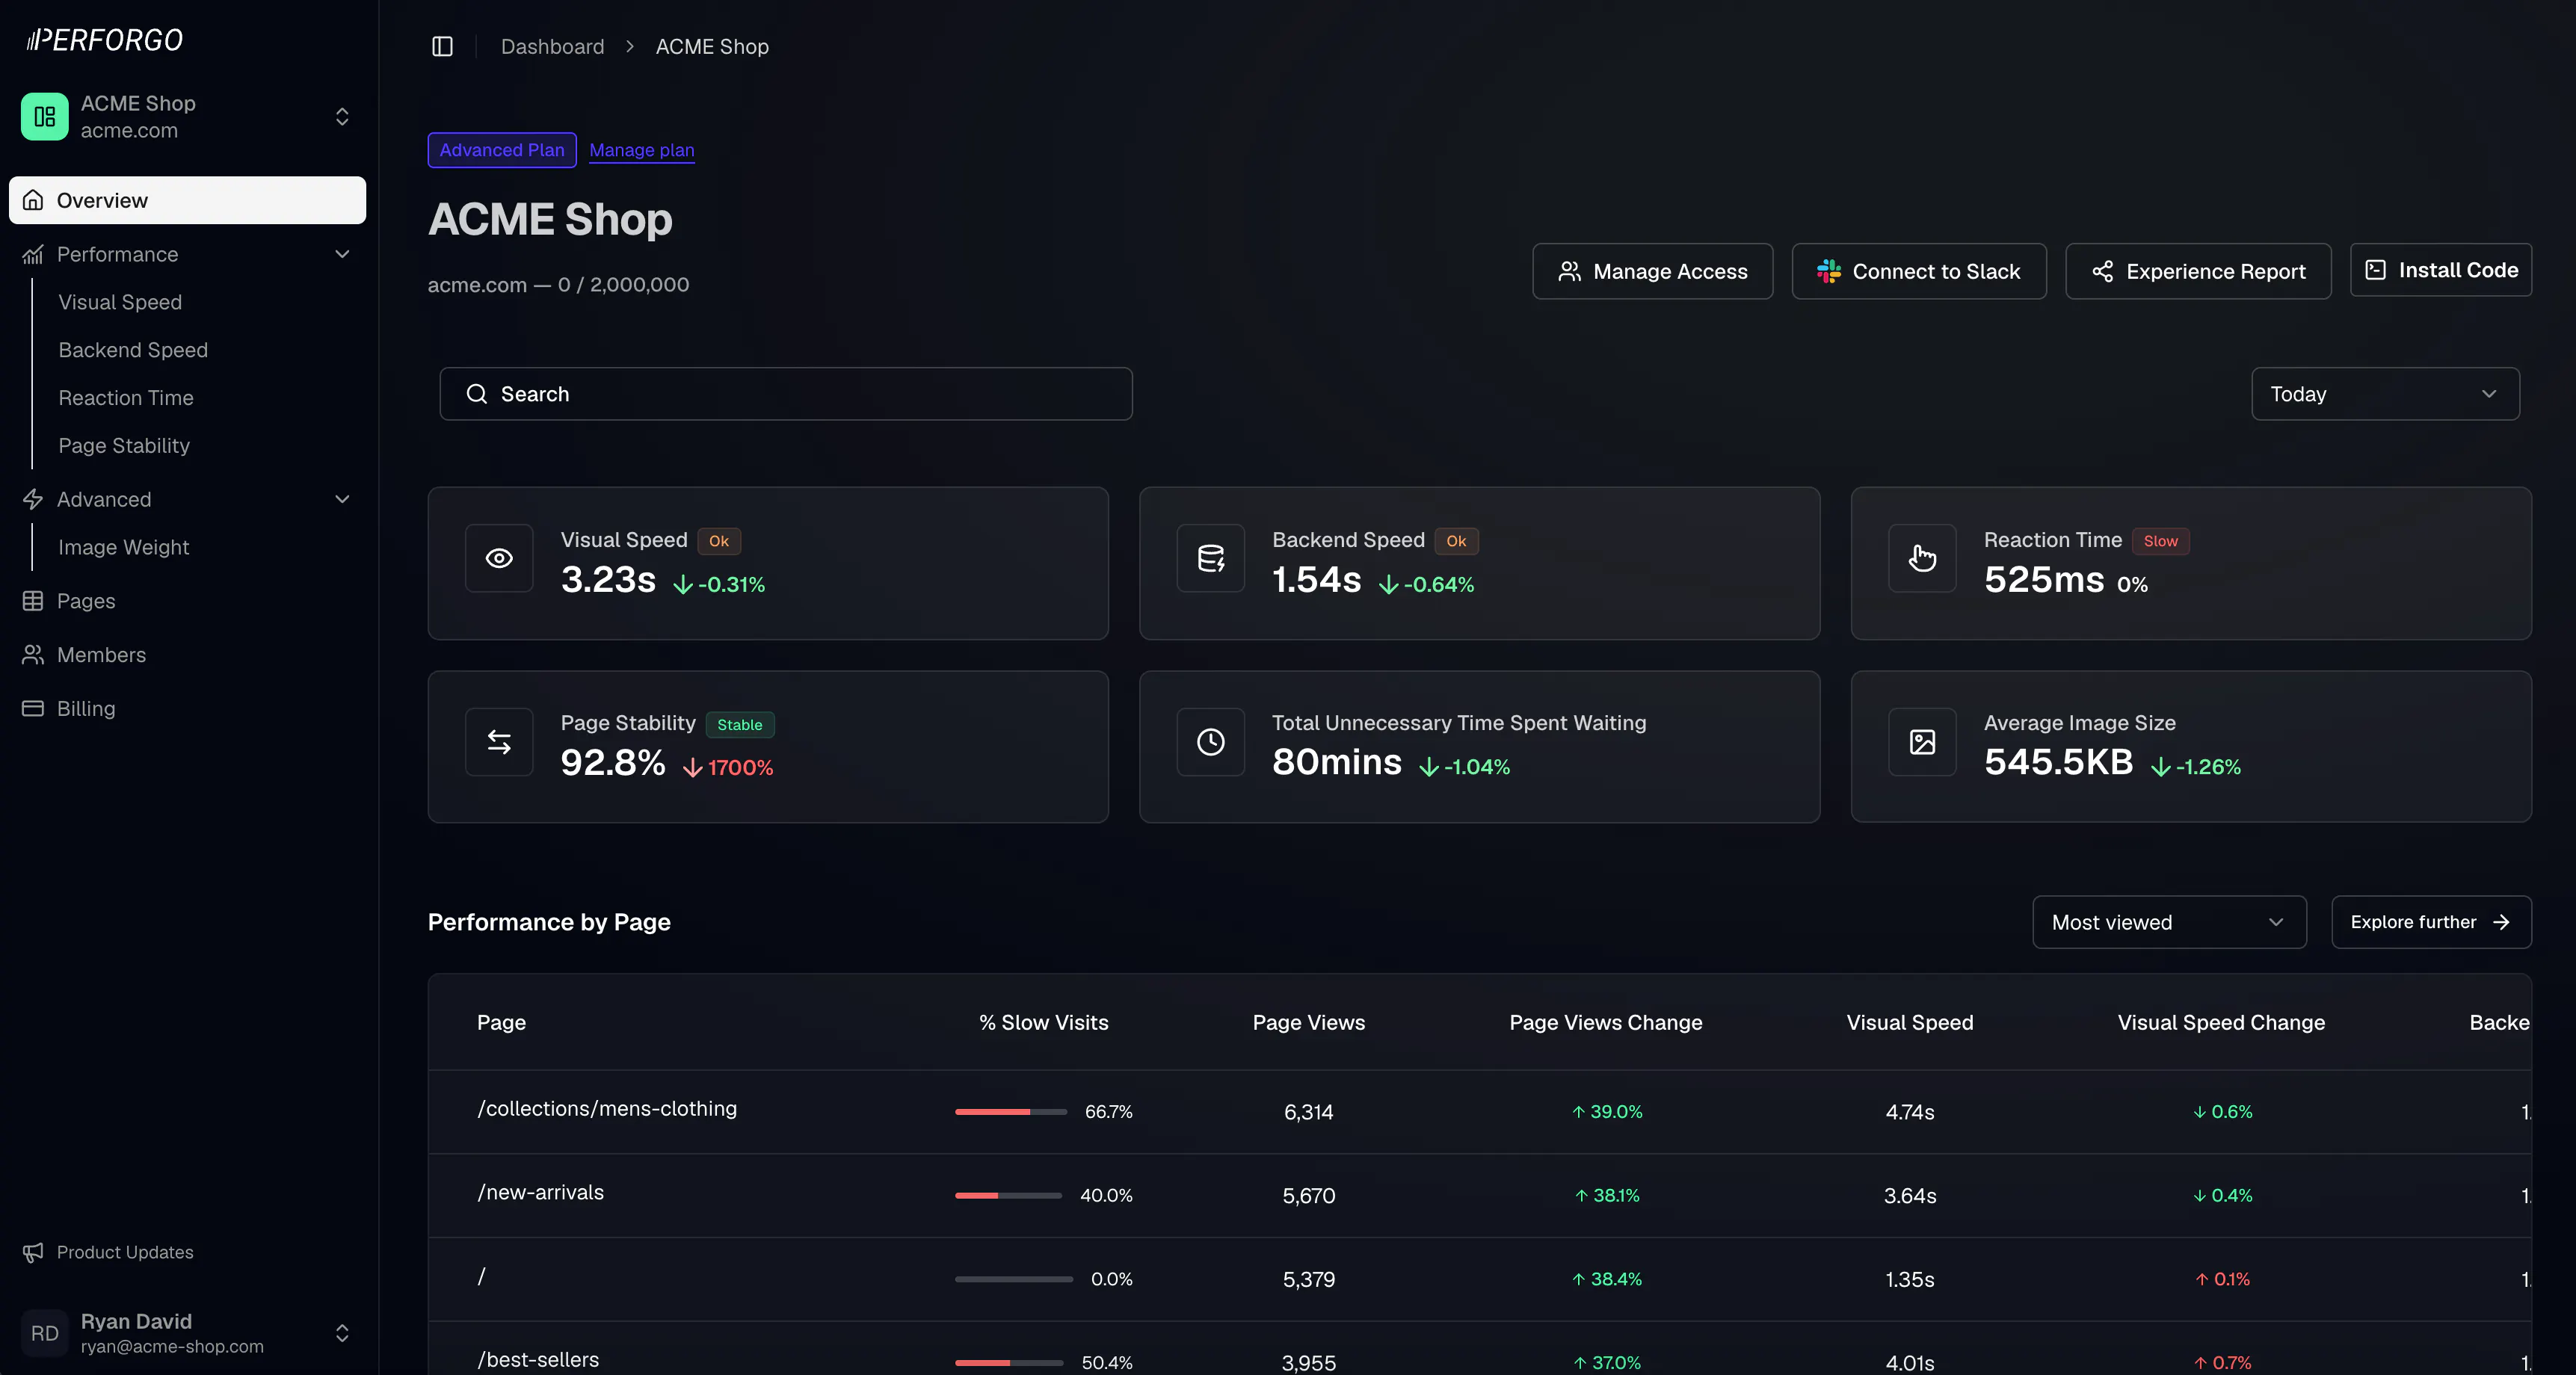
Discover trending pages with the highest % of slow visits to quickly identify page speed issues on pages gaining traction.
Discover where you're losing customers due to poor website performance.
Real-time Core Web Vital monitoring using 100% real user metrics, distilled into plain speaking language so everyone on the team can understand.
No card details required · Copy & paste code snippet · Works on any website
Measure What Matters
How you experience your website when you're at home or in the office is often very different to how people out in the wild experience it. We show you key indicators that tell you exactly how your users are really perceiving your website, all 100% based on real user experience data.
Installation
Enter your domain, add the code below to your website and come back here to see your website performance in real time. No sign up required. Need help installing? Our squad of engineers are on hand to assist. Email us at installation@perforgo.com
Calculate The Cost of Waiting
Each additional second of load time can reduce conversion rates by approximately 5–10% on average, with much steeper drops after 2–3 seconds.
Illustrative example.
This interactive calculator is designed to provide a loose personalised estimate of the potential revenue recovery opportunity for your website based on the inputs you provide. It uses industry benchmarks and assumptions to calculate the estimated recoverable revenue, but it does not have access to your actual website performance metrics and revenue. Perforgo can help you understand your website's current performance by measuring site speed and other experience metrics from every visitor to your site to get an accurate measurement of your website's performance in real time.
Every 1 second of load time saved does not guarantee an additional 7% increase in revenue. For example if your site is loading on average in 8 seconds (which is very slow by industry standards), saving 1 second would not necessarily result in a straight 7% increase in revenue but reducing load times to 2.5 seconds from 8 seconds is a lot more noticeable for customers and could result in much more significant improvements that are higher than 7%. In short the results from performance improvements are not always linear.
Studies from Akamai, Google, and Portent show that each additional second of load time can reduce conversion rates by roughly 7–20%, depending on context.
Pricing
Add spending caps and change or cancel plans whenever you want. Every plan comes with a generous free event allowance and infinite teams and members. Prices shown are per website.
Discover trending pages with the highest % of slow visits to quickly identify page speed issues on pages gaining traction.
Perforgo can now send your website performance summary to Slack.
It's now possible to see how groups of pages are performing across locales.